Overlay: Sales
The Sales layer shows current listings and recently sold properties on the map. The Market snapshot panel beside the map summarises what is in your map view.
How to view sales and listings
Click the Sales button at the top of the map.
What you will see on the map
On the market properties show in green, with the listing type noted, for example Auction, Negotiation or an asking price.
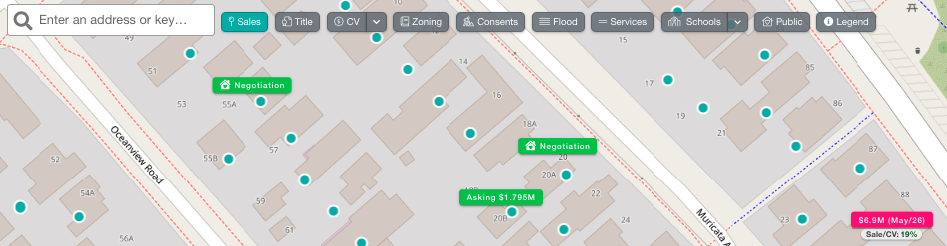
Recently sold properties (last 12 months) show in pink, with the sale price, the month and year, and Sale/CV. Sale/CV shows how the sale price compares to the council value (CV). A positive percentage means it sold above CV, and a negative percentage means it sold below CV.
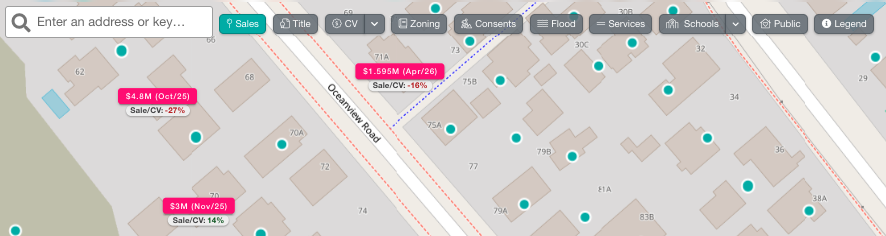
For agents on the Relab Agent Plan, you will also see unconditional sales written on the pink dollar value if a property has sold but hasn't settled yet.
Market snapshot
The Market snapshot panel on the right of the map, titled In this map view, summarises the sales and listings in the area you are looking at. It updates as you move and zoom the map.
[SCREENSHOT: Market snapshot panel open beside the map]
Sold and For sale — the number of map locations in view for each.
Recent disclosed sales — the number of sales in the last 30 days and the last 90 days.
Median disclosed sale price — the median price of the sales in view, with the number of sale prices it is based on and the range of sale dates.
Median sale vs council value — how the median sale compares with council value, with the share of sales that were Above CV, Equal to CV and Below CV.
Listing mix — the share of current listings by sale method: Auction, Advertised price and Other method.
Activity in view — the number of sold, for sale and other locations in view.
Sold price distribution — how many sales fall into each price band, from under $1M to $2M and above.
Open More details at the bottom of the panel for notes on how the snapshot is calculated.
How the snapshot is calculated
It is based on the results returned for the visible area and the layers you have turned on. Results may be capped and don't cover every property.
Sales without a recorded price are not shown on the map or counted.
Sale statistics exclude grouped locations, unconditional sales and non-positive prices.
Prices are in NZD. Council value is a rating valuation, not a current market estimate.
A location that represents multiple properties is counted once.
FAQs
Where can I find listings or sales on the map?
This feature is available nationwide.
How can I find a list of current listings that are NOT currently sold?
Current listings can only be viewed in map format - a list view isn't available. However, the list view feature is included in our premium product.
How often do listings and sales data update in Relab?
Listings and sales data in Relab update daily to ensure you have the most current market information.
Why don't the snapshot numbers match the icons I can see on the map?
Each result has one activity status, and a location that represents several properties is counted once. Sales without a recorded price are not counted, and the results for a busy area may be capped.
Are unconditional sales included in the sale statistics?
No. Sale statistics in the Market snapshot exclude unconditional sales.
Last updated: 15 October 2026